
Fact Brief · October 2026
Cost of Living for Gen Z
Do you face a different basic economy than your parents and grandparents did at your age? These facts will help you answer that question for yourself.
This brief compares young adults at the same age in three years — the latest year published, 2005 and 1985 — using one measurement series per line, so the comparison is apples to apples. Where a series starts later than 1985, it says so. Every number prints its own year.
| Benchmark premium — the price of the second-lowest-cost silver plan on the Affordable Care Act marketplace, before any subsidy. | Cost-burdened — paying more than 30% of income for housing. |
| Dollars of the day — the figure as reported that year, not adjusted for inflation. | Householder — the person in whose name a home is owned or rented. "Under-35 households" are headed by someone under 35. |
| Living in a parent's home — in Census counts, an unmarried college student in a dorm is counted as living at home. | Median — the middle value: half above, half below. Not the average. |
| Price-to-income — median home price divided by median household income. 5 means the median home costs five times a year of median income. | Ratio, share — a cost divided by an income in the same year. Needs no inflation adjustment. |
| Real dollars — a figure adjusted for inflation, so we can compare past dollars to today. Tables say which year. | Transfers — money from government programs such as Social Security, food assistance or tax credits. "After taxes and transfers" counts them as income. |
| Underemployed — working in a job that typically does not require a college degree. It does not mean part-time. |
Each row is one measurement, taken the same way in each year shown. The three columns run newest first: the latest year published, then 2005, then 1985. The year sits inside the cell, because surveys report on different schedules. A dash means the series had not begun. The bracketed number links straight to the source; the same source is listed again at the end.
| Real median household income, 2025 dollars — adjusted for inflation [2] | 2025 | 2005 | 1985 |
|---|---|---|---|
| Householder 25–34 | $94,880 | $74,460 | $67,010 |
| Householder under 25 | $60,870 | $45,220 | $40,200 |
| All households | $87,460 | $72,810 | $63,090 |
| Median income at ages 36–40, after taxes and transfers, vs. the generation before at the same age [3] | Millennials Bn. 1981–96 | Gen X Bn. 1965–80 | Boomers Bn. 1946–64 |
|---|---|---|---|
| Gen Z (1997–2012) is too young to measure. | +18% | +16% | +27% |
Census Bureau, Current Population Survey; Federal Reserve Board working paper (one study, not peer-reviewed).
| Latest | 2005 | 1985 | |
|---|---|---|---|
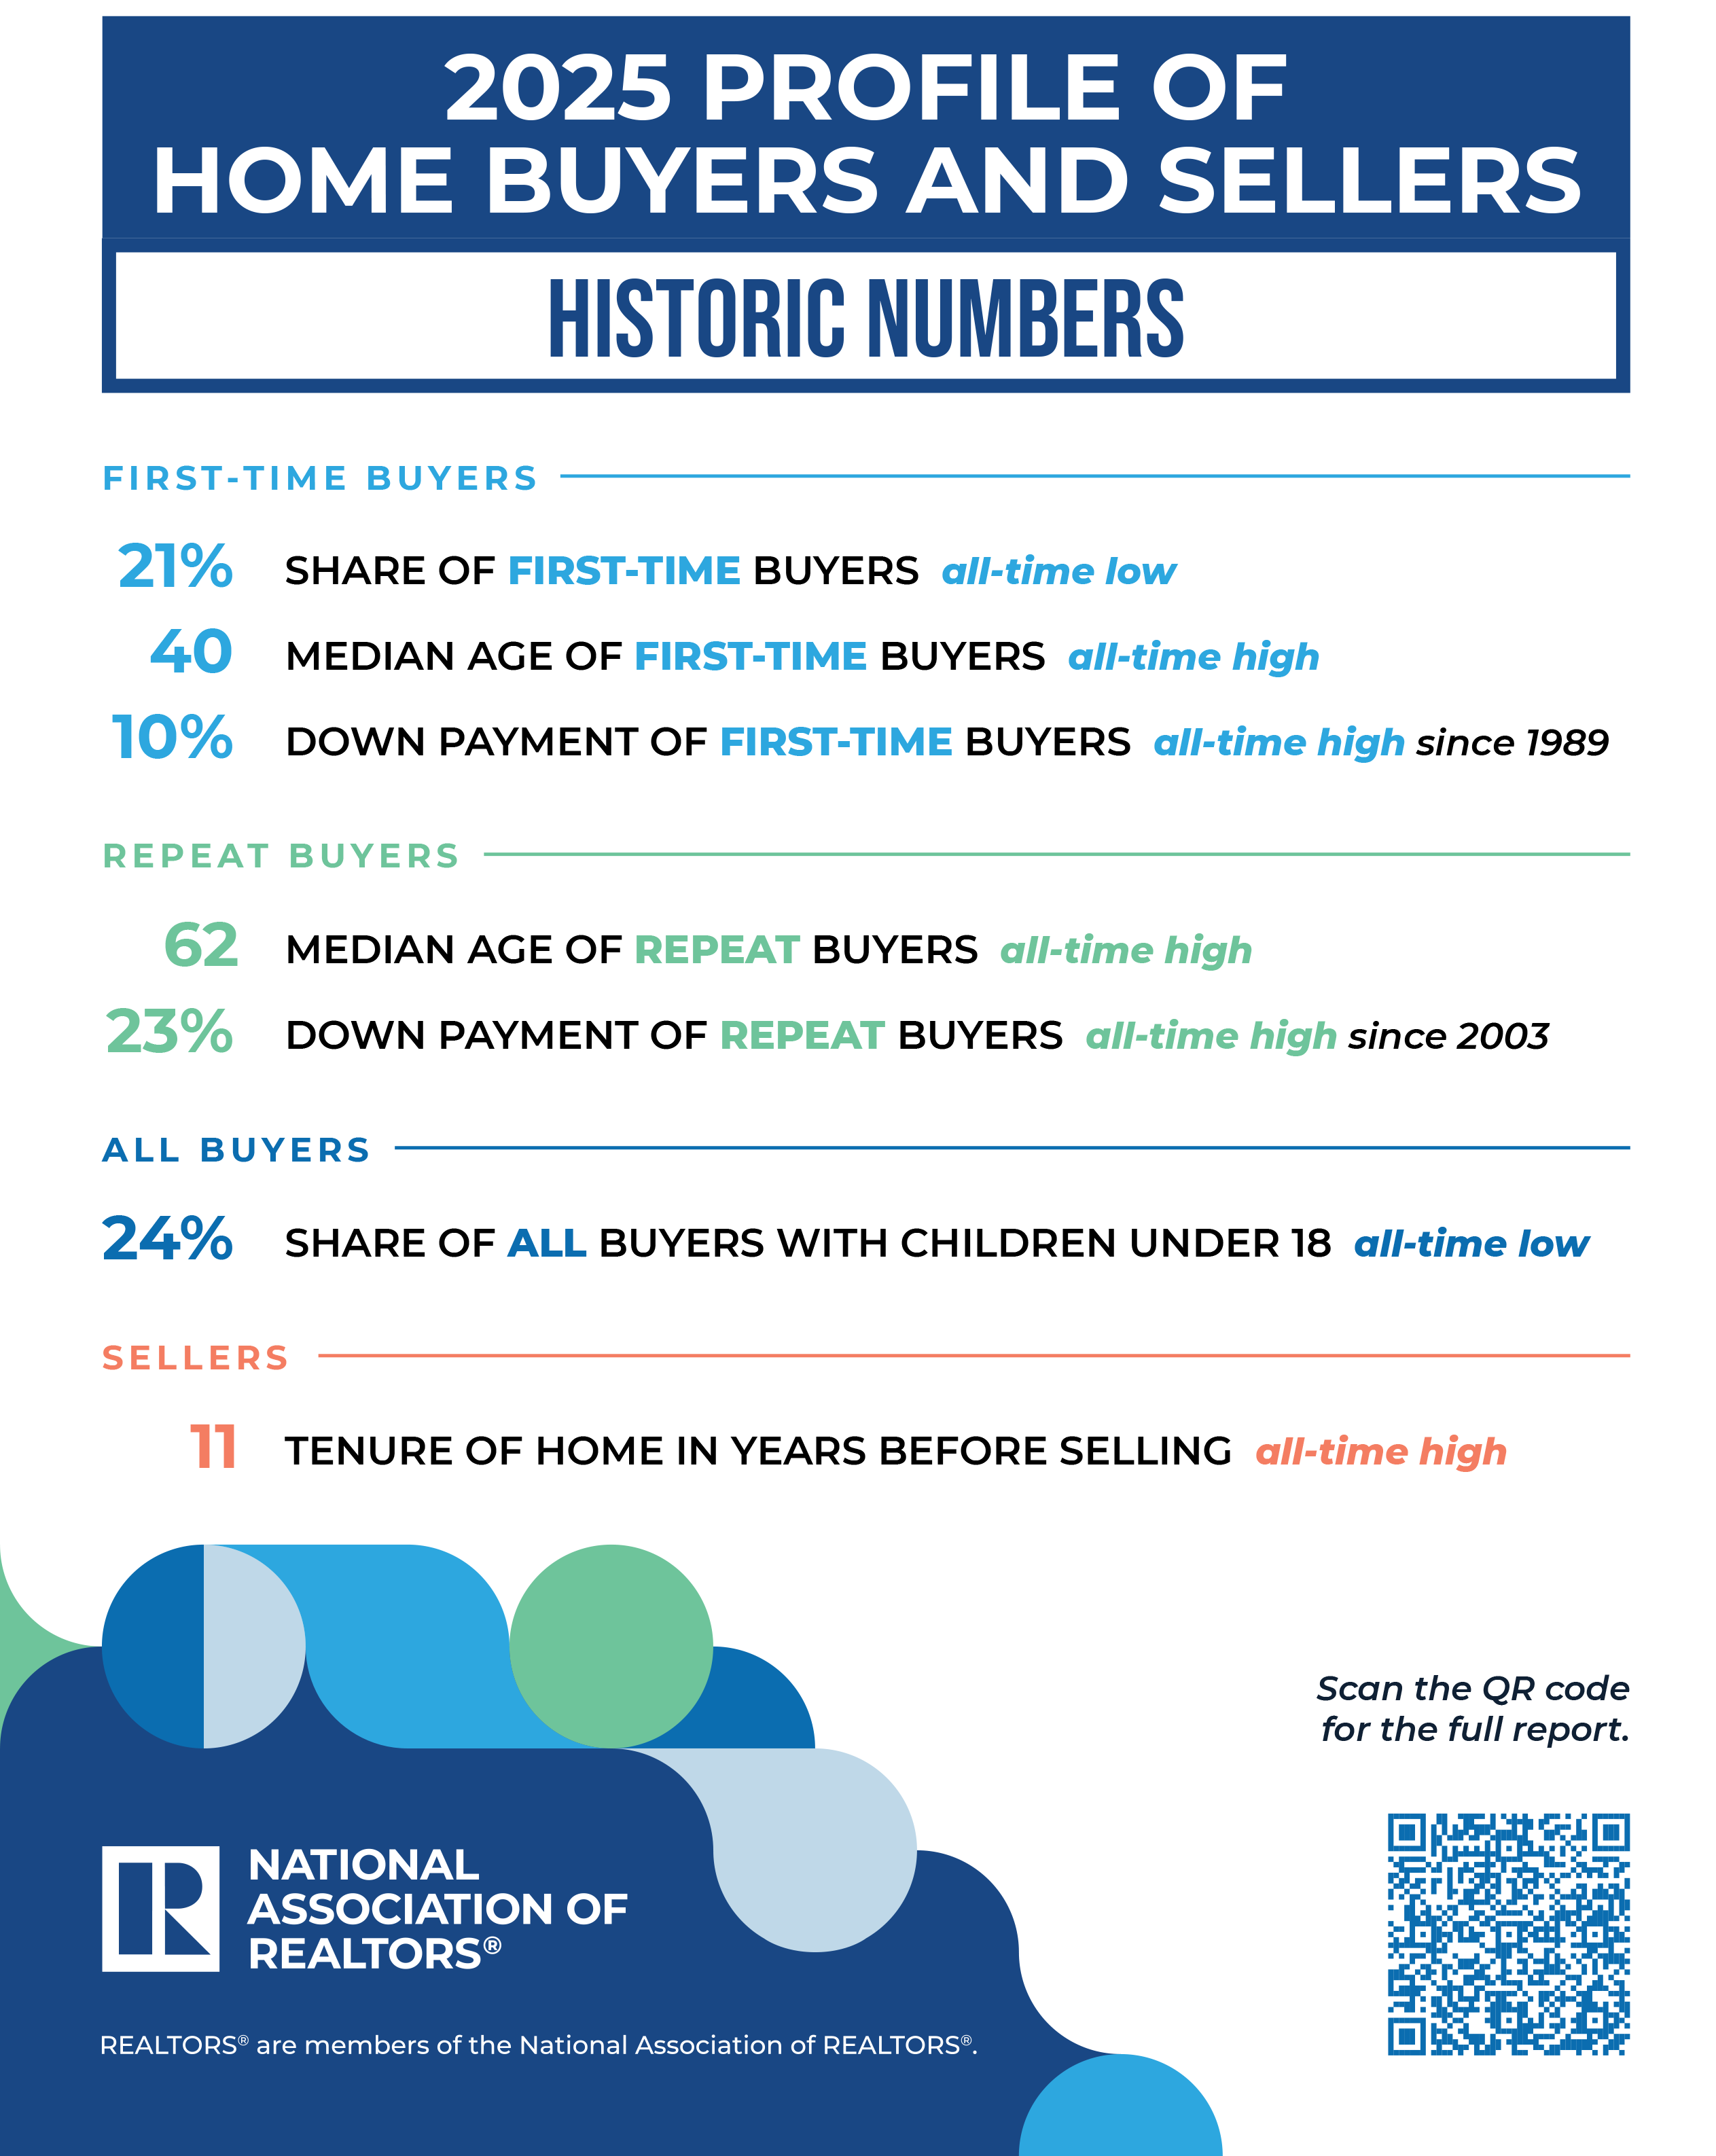
| Median age of first-time buyer, realtor association survey — same survey all three years [4] | 40 (2025) | 32 | 29 |
| Same, from records of closed mortgages [5] | 32–33 (2025) | — | — |
| Households headed by someone under 35 who own their home [6] | 37.0% (2025) | 43.0% | 39.9% |
| 30-year mortgage rate, Freddie Mac weekly survey [7] | 7.28% (Oct. 2026) | 6.30% | 11.31% |
| Median down payment, first-time buyers, share of price [30] [31] | 10% (2025) | about 3% | about 10% (1989) |
| Median down payment, repeat buyers [30] [31] | 23% (2025) | about 16% | about 23% (1989) |
| Median existing-home sale price, dollars of the day [8] | $429,100 (Aug. 2026) | $219,000 | $75,500 |
| Home price [8] ÷ median household income [2], all households [9] | about 5 (2025) | 4.7 | 3.2 |
| Total monthly cost of the median-priced home — mortgage, taxes, insurance — dollars of the day [10] | $3,168 (2025) | $1,698 | $996 (1990) |
Mortgage-rate readings are the weeks of Oct. 1, 2026, Dec. 15, 2005 and Dec. 13, 1985. Under-35 ownership was 35.2% in April–June 2026. The monthly-cost series begins in 1990 and assumes 3.5% down. Down payments for 2005 and 1989 are read from NAR's chart; loan records put the mid-2000s at 3% and 20%.
| Latest | 2005 | 1985 | |
|---|---|---|---|
| Median asking rent for vacant units, dollars of the day [11] | $1,490 (2025) | $605 | $343 (1988) |
| A year's asking rent [11] ÷ median household income [2], same year | 20.4% (2025) | 15.7% | 15.1% (1988) |
| Renter households paying over 30% of income for housing (considered cost-burdened) [12] | 49% (2024) | 40.6% (2001) | 35% (1980) |
| Average yearly rent increase, Consumer Price Index [13] | 3.5% a year (2005–26) | 3.3% a year (1985–2005) | — |
The Census asking-rent series begins in 1988. The cost-burden series has 2024, 2019, 2001 and 1980.
| 2025 | 2005 | 1985 | |
|---|---|---|---|
| Ages 18–34 living in a parent's home (college students in dorms counted as home) [14] | 33.0% | 26.9% | 28.1% |
Computed from Census counts: 25.2 of 76.4 million (2025); 18.1 of 67.3 million (2005); 19.3 of 68.7 million (1985).
| Public four-year, in-state, 2025 dollars [15] | 2025–26 | 2005–06 | 1985–86 |
|---|---|---|---|
| Published annual tuition and fees | $11,950 | $9,050 | $3,950 |
| Annual tuition and fees plus housing and food | $25,850 | $19,980 | $11,550 |
| Latest | 2005 | 1985 | |
|---|---|---|---|
| Pay premium for a bachelor's degree or higher over high school only — median weekly pay of full-time workers 25 and over (a yearly snapshot, not lifetime earnings) [33] | +80% (2025) | +74% | +52% |
| Student loans | Latest |
|---|---|
| Share of bachelor's degree recipients who graduated with debt [34] | 47% (2023–24) |
| Average debt at graduation, among those who borrowed [34] | $29,560 (2023–24) |
| Interest rate on a new federal undergraduate loan, fixed for the life of the loan [35] | 6.52% (2026–27) |
Enrollment-weighted averages of published prices, before grants. The pay premium is computed from BLS medians: $1,740 vs. $966 (2025), $1,013 vs. $583 (2005), $506 vs. $333 (1985).
| Latest | 2005 | 1985 | |
|---|---|---|---|
| Share of 18–24-year-olds enrolled in college [16] | 39.0% (2022) | 38.9% | 27.8% |
| Unemployment rate, all workers, September [17] [18] | 4.2% (Sept. 2026) | 5.0% | 7.1% |
| Unemployment, recent college graduates ages 22–27 [19] | 5.7% (June 2026) | 4.4% | 3.4% (1990) |
| Unemployment, all workers ages 22–27, any education [19] | 7.2% (June 2026) | 8.5% | 7.6% (1990) |
| Recent graduates working in jobs that do not typically require a degree [19] | 42.0% (2026) | 44.1% | 42.9% (1990) |
The graduate series begins in 1990 and reports 12-month averages; readings are June 2026, January 2005 and January 1990.
| 2025 | |
|---|---|
| National average annual price of child care for one child, all ages and settings [20] | $13,184 |
Child Care Aware of America, an advocacy organization; average of three methods across 47 states. No comparable series exists for 1985 or 2005.
| Latest | 2005 | 1985 | |
|---|---|---|---|
| Worker's yearly share of an employer family plan [21] [22] | $6,850 (2025) | $2,713 | — (series begins 1999) |
| Worker's yearly share, single coverage [21] [22] | $1,440 (2025) | $610 | — |
| Buying your own coverage: benchmark marketplace premium, age 40, before subsidies [23] | $7,500 a year (2026) | — | — (begins 2014) |
| Health care as a share of all household spending [24] [25] | 7.9% (2024) | 5.7% | 4.7% |
Employer plans: the employer paid $20,143 of the family premium in 2025 and $8,167 in 2005.
| 2024 | 2005 | 1985 | |
|---|---|---|---|
| Food as a share of all household spending [24] [25] | 12.9% | 12.8% | 14.8% |
| Food as a share of income before taxes [24] [25] | 9.8% | 10.1% | 13.8% |
| Latest | 2005 | 1985 | |
|---|---|---|---|
| Regular gasoline, price per gallon, dollars of the day [32] | $4.20 (Aug. 2026) | $2.51 (Aug. 2005) | $1.23 (Aug. 1985) |
In 2024 the average household spent $6,224 on groceries and $3,945 eating out. Gasoline readings are August of each year, from one monthly series that begins in 1976; the price hit $2.93 in Sept. 2005 after Hurricane Katrina and was $3.07 in Feb. 2026.
| Latest | 2005 | 1985 | |
|---|---|---|---|
| Median age at first marriage, men / women [26] | 30.2 / 28.6 (2024) | 27.1 / 25.3 | 25.5 / 23.3 |
| Mother's average age at first birth [27] [28] [29] | 27.6 (2024) | 25.2 | 23.7 |
When you hear a claim, ask
- Same age? A 60-year-old's wealth against a 28-year-old's measures age, not generations.
- Same measurement? A mail survey and a mortgage record put the first-time buyer at 40 and 33 in the same year.
- Sticker or net? Dollars of the day or real dollars? Share or dollars?
- Which age band — under 35, 25–34, 22–27? They are not interchangeable.
- Is it a measurable fact or an assumption, opinion or attribution? Births, jobs and living arrangements are counted; motives are not.
What do the facts say to Gen Zers?
- Income at the same age is higher than your parents' and grandparents' was, after inflation.
- Housing, college, and health care are the main costs that take a larger share of income than in the past.
- The main cost is housing. The median home price is now about five times median household income, up from about three. A year's asking rent equals about a fifth of median household income, up from about a sixth. Ownership under 35 is down from 43% to 37%.
- The mortgage rate is below your grandparents' and about a point above your parents'. The price is the bigger difference.
- One in three young adults lives at home or in dorms, up from one in four — the 1980s were higher than the 2000s.
- College sticker price tripled in real terms; the pay premium for a degree rose from about 50% to 80%; graduate underemployment has not changed in 36 years.
- Food takes about the same share of spending as in 2005; health care takes more.
- Marriage comes about five years later than in 1985; first births about four.
Harvard Joint Center for Housing Studies — jchs.harvard.edu. Publishes The State of the Nation's Housing every June and America's Rental Housing every other spring, with interactive tables updated in between. Housing is the cost that changed most for young adults, and this is the one resource that republishes the numbers on a schedule.
Every Fact Brief follows the same discipline — so you can trust what's on these pages, and check it yourself.
Get the Facts <> Share the Facts